Supply and Demand: How the Stock Market is affected
- Sai Vikram Kolasani

- Jun 28, 2020
- 2 min read
Overview:
What is Traditional Supply and Demand?
How is the Stock Market Affected?
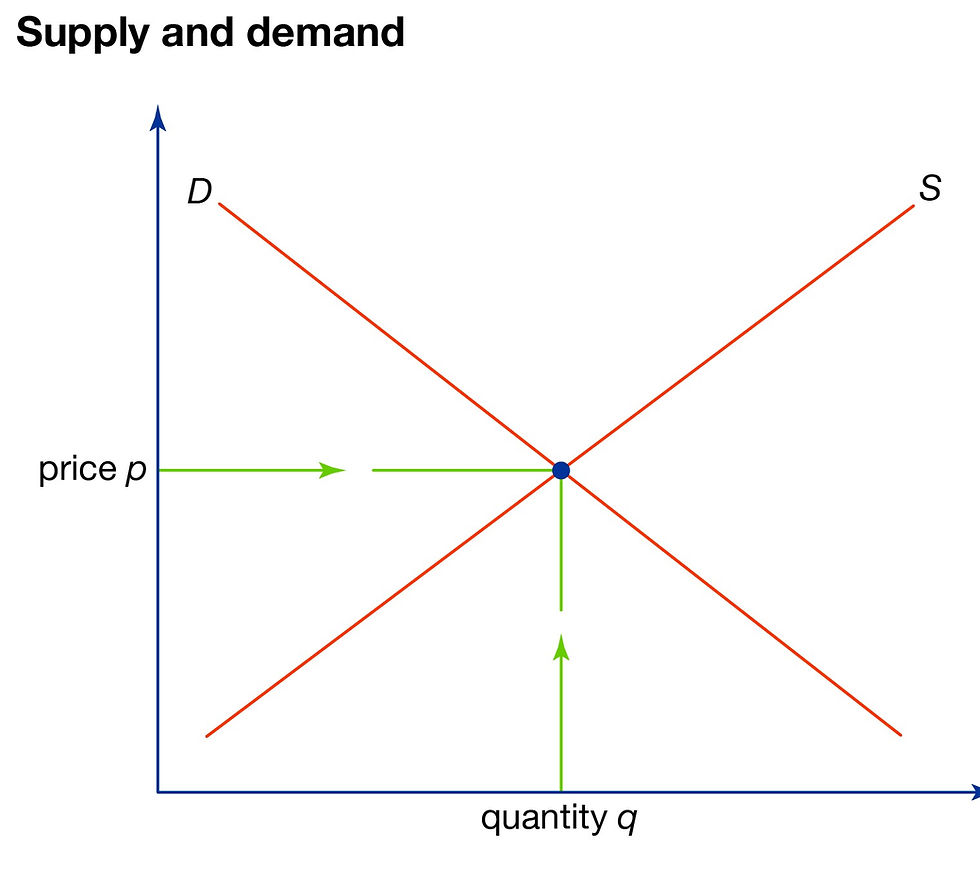
Traditional Supply and Demand
In the context of supply and demand discussions, demand refers to the quantity of a good that is desired by buyers. An important distinction to make is the difference between demand and the quantity demanded. The quantity demanded refers to the specific amount of that product that buyers are willing to buy at a given price. This relationship between price and the quantity of product demanded at that price is defined as the demand relationship. Supply is defined as the total quantity of a product or service that the marketplace can offer. The quantity supplied is the amount of a product/service that suppliers are willing to supply at a given price. This relationship between price and the amount of a good/service supplied is known as the supply relationship. When thinking about demand and supply together, the supply relationship and demand relationship basically mirror each other at equilibrium. At equilibrium, the quantity supplied and quantity demanded intersect and are equal. Typically when the supply is high but the demand is low, the prices will reduce by a great margin; however, when the supply is low and the demand is high, the prices will skyrocket.
How does this relate to the Stock Market?
There are few major ways that the Stock market is affected.
1. The first thing I like to look at is the supply of Stock. When choosing between two similar stocks, always choose the one with lower stock supply, as more times than not it will be more volatile. Furthermore, Companies where the Floating supply is lower are much better to invest in. Floating supply is the number of stocks that are available for purchase after subtracting stock that is closely held. In this regard, companies where the top management owns a large percentage of stock is better for investing as well.
2. Excessive Stock Splits May Not be the Best
From time to time companies make the mistake of excessively splitting their stocks. Splitting a stock is increasing the number of stocks by reducing the prices and adding a proportional number of stocks. For example if a company had 50 stocks at 10 dollars, it can do a 2 to 1 split where it will now become 100 stocks at 5 dollars. Usually when companies excessively split stocks, it may be in your best interest to sell, as with historical data stock prices fall after this action.
3. Look for Companies Buying their Own Stock in the Open Market
This is usually a great sign that the company is moving in a positive direction When a company buys its own stocks in a large amount such as 10% this is called a buy back. The result of a buyback is that the number of shares are reduced and this usually implies that the company expects improved sales and earnings in the future. This will therefore increase the EPS of the stock.
4. Look for key high demand points
When analysing using the chart patterns discussed earlier, a key indicator of the buying point is when the volume of stocks bought or demand is a great margin over the average volume for the last 3 months.


Comments